Day 2 at SVP
 Another day, another long list of talks and posters to see. Here is a brief synopsis of the talks I attended. I only wish I had the time to fully discuss everything that went on and all the material covered, but that would take volumes of material and far more time than I have. As before, if any of the talks sound sufficiently interesting that you want more information, please ask and I will discuss them in more detail. I realize that there are a lot of terms and creature names that may not be familiar to all readers, but the greatest learning takes place when one asks questions, so ask and ye shall receive.
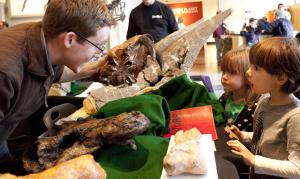
Adam Huttenlocker showing fossils to kids at the Burke Museum. Photo by Lara Shinn.
The big session for today was for the Romer Prize. Alfred Romer one of the most influential vertebrate paleontologists of the 20th century, so every year, SVP awards the Romer Prize to the best presentation by a predoctoral student. A student usually applies within a year of completing their PhD. Those that successfully apply give a talk in the Romer session at SVP, which are voted on by the prize committee and awarded at the end of the conference. It is the highest honor a vertebrate paleontology student can win and so is quite an honor. This year went to a friend of mine I went to grad school with by the name of Adam Huttenlocker.
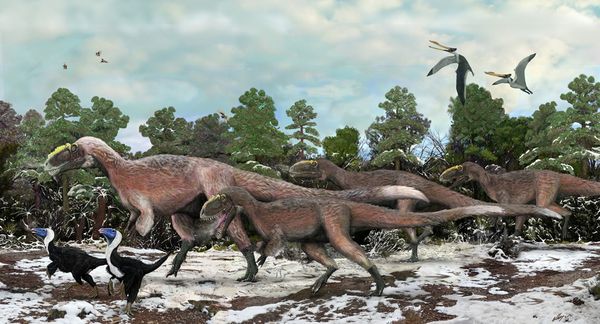
 The first Romer talk I attended was by Stephen Brusatte, who talked about theropod dinosaur phylogeny, finding that while there is good support for a number of relationships in the theropod lineage, we still don’t have a good handle on how the early coelurosaurs, such as tyrannosaurs and ornithomimids, fit into the theropod family tree. He was able to conclude, after a detailed analysis of birds and their closest nonavian dinosaur relatives, that there is no real distinction to be made between them that truly delineates birds from other dinosaurs, giving further support to the dinosaur-bird hypothesis. Nevertheless, once birds did evolve, they evolved quickly, rapidly diversifying. Stephanie Drumheller looked at bite marks to see if you can tell the difference between crocodylians by what damage they leave on the bones. Thomas Evans looked at literally thousands of bones in rivers and found that what we have traditionally expected bones to look like after being carried downstream did not really match the reality at all, forcing us to have to rethink our assumptions of how much we can really say about fossils based on their condition. Adam Huttenlocker examined the “Lilliput Effect” after the Permian extinction. It has been noted that after mass extinctions, animal body sizes decrease, but exactly why that occurred was unclear. What Adam found was that selective extinction of the larger, faster-growing groups was the best explanation in this case. One might ask what other possibility might there be, which would be that all the animals simply got smaller, with some going extinct, but Adam found that smaller species did not alter their size through the extinction, they just survived when the large, fast-growing species died out. Neil Kelley was able to determine, in large part, the diet and feeding behaviors of most ichthyosaurs based on their morphology. Stephan Lautenschlager did a detailed study of therizinosaurs found that having beaks reduced stresses on their jaws and their famous giant claws were likely used to hook and pull vegetation, not for digging or fighting (at least, not primarily). Yasuhisa Nakajima used 3D micro-CT analysis to determine changes in bone growth and how much that can tell us about growth in extinct animals and James Neenan provided the first complete phylogeny of placodonts, the earliest group of marine reptiles.
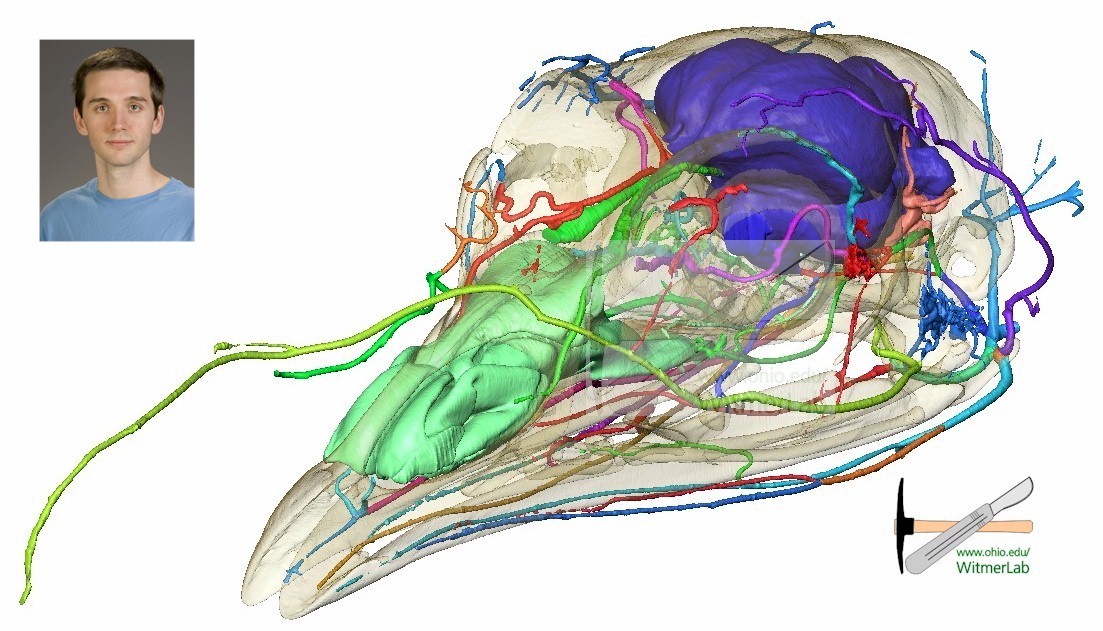
Blood supply in the turkey. By William Porter.
Dinosaur noses got a lot of attention this meeting. William Porter mapped blood circulation in the dinosaur Camarosaurus, A.W. Crompton studied the evolution of turbinates in the nasal passages of early therapsid mammaliforms, indicating that they may have originated as a countercurrent heat exchanger to help regulate body temperature. Tomasz Owerkowics also discussed the role of turbinates in mammals in thermoregulation, but found they do not serve that purpose in birds or other reptiles. Along the way, they discussed the evolution of the different breathing apparatuses in mammals and reptiles. Robert Eagle also looked at dinosaur thermoregulation, but did so using carbon and oxygen isotopes measured together, which indicated a mammalian level body temperature for sauropods, but somewhat lower for oviraptors (although still higher than modern reptiles). Having large brains is often linked to higher metabolism and both ornithomimimosaurs and troodontids have been considered to have large, almost avian-like brains, but Harry Jerison found that at least their forebrains, while large for most dinosaurs, were still lower than avian forebrains. Going back to therapsids and the permo-triassic extinction, Jennifer Botha-Brink found that therapsids showed reduced life span and earlier reproductive maturity after the extinction event, consistent with what one might expect from populations that lived through an ecological catastrophe with reduced resources.
In strictly morphological evolution studies, Gabriella Sobral found that the fenestrated middle ear, which helped improved hearing capabilities, was not a unique event, but evolved independently six times within dinosars alone and was even rather inexplicably lost in stegosaurs, ankylosaurs, and oviraptors. Henry Tsai looked at hip joints in saurischian dinosaurs and found the femur did not fit the hip socket very well, indicating a lot of soft tissue must have been present in life and that the amount of soft tissue increased as the animals got bigger. Nicholas Campione came up with a new way of estimating body mass for bipeds to get around the fact that the standard equations were designed for quadrupeds and don’t work all that well for bipeds. It turns out that a simple correction factor of the standard equations worked fairly well, simply multiply by the square root of two. now to figure out just how well that really works and why. One potentially confounding factor is that it was based on living birds. I doubt it would hold true if used on say, a kangaroo. Finally, the last talk I want to mention was by Kevin Padian, who after discussing the earliest known bats, proposed that they never glided, but instead used their early wings to make a fluttering, control descent from trees. In his view, bats evolved from mostly terrestrial forms that ran up into trees to avoid predators (much like Dial‘s talk of the previous day), were insectivorous, and jumped out of trees to flutter farther and farther distances. He openly admitted this part was currently speculation and will need much more evidence before it should be accepted as definitive, but was a plausible hypothesis which can be tested, which I think is the mark of a good scientist, clearly delineating between what we know and what we think, between fact and a possible explanation.
So what of this, if any, looks interesting to you? What would you like to know more about?
Day 1 at SVP
I attended the annual meeting of the Society for Vertebrate Paleontology (SVP) last week. This is the yearly meeting where those studying anything with a backbone, from fish to furballs get together to talk about what they have been doing and see what others have found (although admittedly, most of the press goes to dinosaurs). Over the next few posts, I will share brief snippets of what I learned. If you read anything that sounds particularly interesting to you and would like me to discuss it in more detail, just let me know in the comments section and I can expound on the topic.
So what does a scientific meeting like this look like? There is always a dealers’ room, where you can find an array of book publishers, such as Indiana Press and CRC Press, and supply companies, such as Paleo-Tools and Bone Clones, and many others all hawking their wares. You will meet artists such as Luis Rey, learn about what’s going on at different publications, such as PLOS One, and upcoming meetings. There are the business meetings, social events, and award banquets. There are field trips to local paleontolgical sites (this meeting was in Los Angeles, so the La Brea tar pits and the Los Angeles Natural History Museum were highlights). There is also the chance to converse with paleontologists from all over the world, a venue wherein colleagues can talk face-to-face and forge new connections, where students can get their feet wet presenting at an international conference and talk to students of other professors to learn about potential graduate and post-graduate opportunities, which professors make good mentors and which ones to avoid. And of course, there are the talks and poster sessions, where you can hear about the research people are doing right now. If you want to know the current state of the field, this is the place to go. Every day for four days, three sessions run concurrently, each covering 16 talks a day, plus over 120 posters are presented every day. By the end of which, if you haven’t found enough new information to send your brain into overload, you simply haven’t been trying. This is also a relatively small meeting, with only 1500 or so attendees, unlike some scientific societies which have meeting attendances over 20,000.
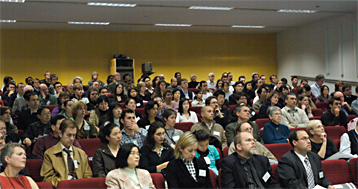
Bosch Institute Neuroscience meeting, 2007. This is a bad design for meetings. Please, just stop.
Before I get into a short recap of the talks I attended (there were many more I would have liked to attend, but I have not yet perfected cloning myself), I will digress a moment for a quick comment about the meeting room setup. My first thought upon seeing the room arrangement was Happy day! All the meeting rooms are right next to each other; not on a different floor, on the other side of a giant building, in another building, or in another facility entirely, unlike some other meetings I’ve attended. This makes popping from one session to another to see different talks much easier. The downside to this is that hundreds of other people all have the same idea and are trying to go through the same hallway, trying to get around the other attendees who are chatting with friends and colleagues. For those of you that are accustomed to New York subways, this is no big deal, but for some of us, it can be a bit claustrophic as personal space shrinks to microscopic proportions. The other rant I have is that, after all this time, they still have not learned how to lay out a room for the talks. They insist on preparing the rooms as though everyone will calmly file in before the talks and sit there until the break, providing long rooms with the speaker at one end and two long columns of interlocking chairs set in rows up to 20 seats long. however, this is a scientific meeting with many short talks. people stream in and out constantly. So what happens is that all the edge seats are quickly taken and great, yawning chasms of emptiness are left in the center. Why no one ever thinks to place the speakers in the middle of a long wall, with many columns of seats with no more than 6-7 seats to a row, allowing ample space for people to move, is beyond me. They might not be able to put as many seats in, but that hardly matters if no one can get to the seats in the first place. Now on to the talks!
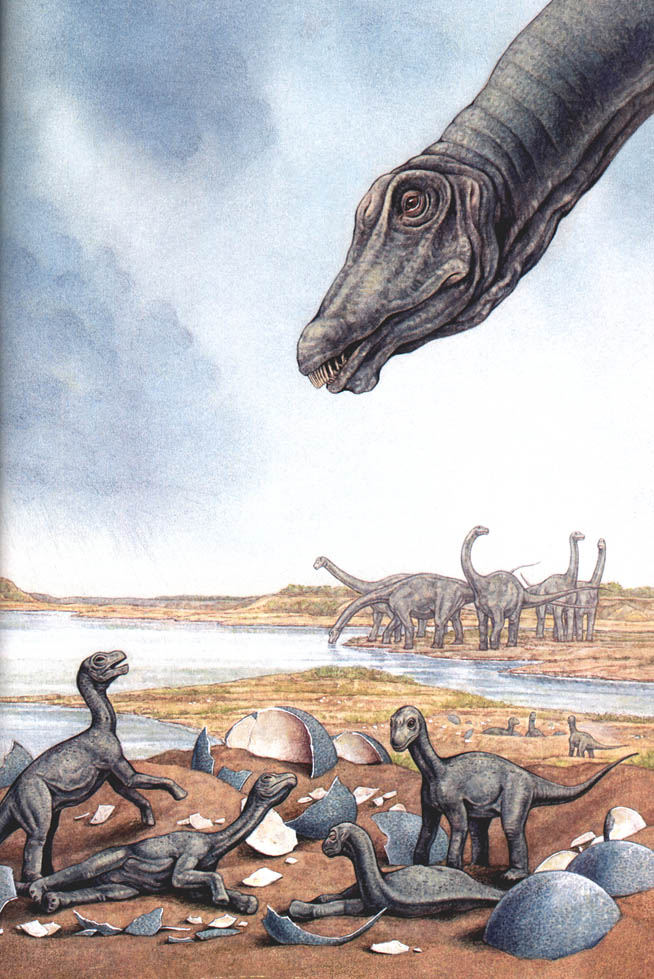
Sauropod nest, by Mike Ellison
In the first session, all the talks dealt with the problems of ontogeny in interpreting the fossil record. Ontogeny, how an animal grows from fertilized egg to old age, can cause several problems in the fossil record. When all you can see is a fossil, it can be very hard to tell if you are looking at an adult or juvenile. Many animals can change so much during development that the juveniles can look like completely different species. Hans Larsson presented about a possible way to figure out rough ages of an animal by looking at how different bones in the skull covaried, or how they changed shape in relation to each other as they grew. Jack Horner warned against assuming an animal is full-grown unless you have solid evidence of that from the bones across the skeleton and Mark Goodwin showed how difficult that can be with pachycephalosaurs, but Holly Woodward found that at least some dinosaurs reached sexual maturity long before they reached “adult” size and in fact, never stopped growing, so it is important to keep in mind just how one defines “adult.” David Evans showed the problems of using juveniles and adults in the same phylogenetic analysis, in that the relationships of species identified using juveniles were very ambiguous and unstable, often showing up as more ancestral than an adult of the same species, sometimes substantially so. John Scannella found that using just one juvenile specimen of Triceratops in a phylogenetic analysis resulted in that specimen not being identified as a ceratopsian at all, but if a sufficient number of juvenile specimens of different ages were included, they all fell out together in their expected relationship. This indicated the ontogeny problem can be dealt with if you have enough samples, as well as indicating what characters are newly evolved versus being evolutionarily stable. Zachary Morris extended this to show that not all individuals grow up the same way, there was no set pattern of development that all individuals within the same species followed to adulthood, so trying to order specimens into an ontogenetic sequence requires a large sample size. Also, contrary to an earlier research that got a lot of press, Torosaurus is probably not the same species as Triceratops. Robert Reisz showed very fast growth in prosauropod embryos and P. Martin Sander estimated that sauropods could grow to sexual maturity in 16 years, attaining 90% of their maximum size within 32 years. This comes out to an average growth rate of 4 kg/day, which is similar to modern large mammalian herbivores, but he cautioned this was likely overestimating the ages and underestimating the growth rates. Ken Dial discussed the role of predation in the development of flight, with evidence indicating that if predation pressure was relaxed and there was sufficient food resources, birds commonly became flightless.He made the interesting point that everything is a transitional environment; that to truly understand an organism,one has to examine all aspects of their habitat and you can’t afford to get to narrowly focused. Denver Fowler found that animals occupying different niches at different ages were more susceptible to extinction. Caroline Stromberg found that, contrary to popular belief, the development of grasslands didn’t actually correlate very well with high-crowned, hypsodonty teeth.
Wikipedia.org
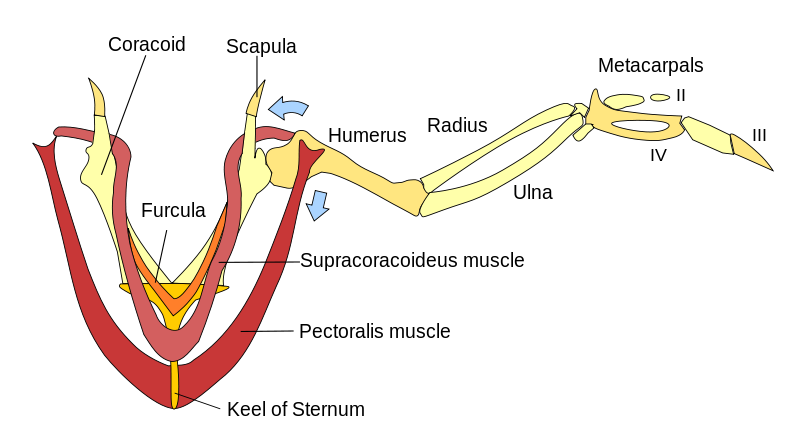
Sandy Kawano looked at how locomotion changed between fin and feet and found that the total forces between front and hind limbs was fairly constant, but acceleration came from the pectoral fins at first, but as the hind limbs developed, more of that motive force came from the hind legs, with the front legs taking on more of a regulatory role guiding maneuverability. Karen Sears found that limb evolution became more modular, in that different parts of the limb evolved at different rates and times, so that each part could be considered as evolving relatively independently, with higher levels of evolution near the ends of the limbs. Paul Sereno discussed the evolution of the coracoid bone in the shoulder and how its loss in almost all mammals created a more flexible and faster, but weaker joint. He opined this is why bats don’t grow to the size of birds or pterosaurs and that it allowed dinosaurs to get bigger and carry more weight than mammals.
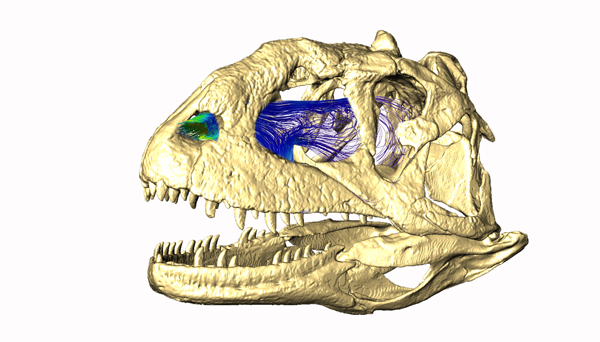
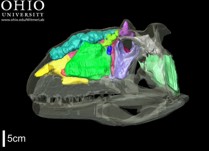
Model of air flow through the nasal passages of Majungasaurus. Image and work by Jason Bourke
Ali Nabavivadeh reported on his studies on the evolution of jaws in ornithischian dinosaurs, finding they talked the problem in a variety of different ways. Lucas Spencer noticed that all early ornithischians were in Gondwana and that dispersal explains more of their biogeography than vicariance (speciation via the emergence of physical barriers). Mark Loewen reported on the biogeography and phylogeny of ankylosaurs, while Victoria Arbour discussed the evolution of the ankylosaur tail club. Philip Currie reported on the smallest known articulated ceratopsid fossil, while Andrew Farke reported on ceratopsian biogeography. Thomas Carr found evidence to support anagenesis (direct ancestor-descendant relationships) in some tyrannosaurs, but not all, while Brandon Hedrick found that fossilization processes made one species of psittacosaurs look like three different ones. Jordan Mallon found little evidence in pachycephalosaur skulls to indicate they lived in upland areas, as is often stated, and Jason Bourke did some very nice computer modeling showing how turbinates (structures within the nasal passages often associated with endothermy, aka warm-bloodedness) work to channel air through nasal passages,using that to find support for respiratory turbinates in pachycephalosaurs.
This all only recounts brief snippets of the talks I attended on the first day and doesn’t include the many posters I looked at. I will cover Day 2 in my next post. If you want more information on any of these snippets, leave a comment and I will be happy to expound upon them.
Forum Friday, winging our way to LA
Paleoaerie is off to Los Angeles next week to attend the annual meeting of the Society for Vertebrate Paleontology. If it has a backbone, it will be discussed there (if it is still alive, the discussion will be linked to fossil relatives, but I didn’t want to unnecessarily limit it, because I’ve seen gators, chickens, dogs, sharks, and everything in between discussed there in relation to their fossil ancestors; I’ve even heard and presented on bacteria, insofar as they help make fossils).
As a result, I’ve only done one blog post on Paleoaerie since last Forum Friday and I won’t be able to post anything other than maybe comments about the meeting next week, so I wanted to get a forum post out before I go, although I realize that some of you reading this may not see it before Monday, what with the lateness of the hour this got posted.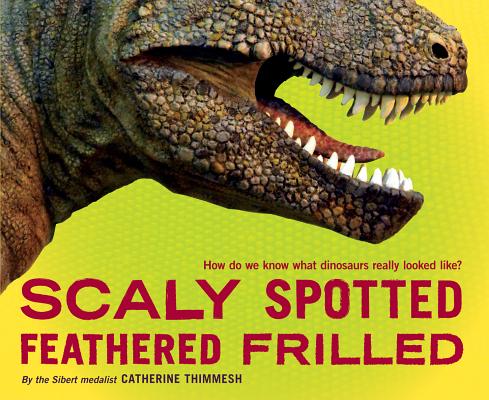
So without further ado, here we go. On Paleoaerie, we talked about the book, Scaly spotted feathered frilled: how do we know what dinosaurs really looked like?” by Catherine Thimmesh, a great book for any budding paleoartist you know.
Over on Facebook, we celebrated Member Night at Mid-America Museum and their new dinosaur exhibit, Reptile Awareness Day, and Geologic Map Day. We learned about the Backfire Effect and why telling people facts is not always convincing and ways to frame your arguments that may work better. We warned against the ResponsiveEd curriculum, as well as Stephen Meyer’s book, Darwin’s Doubt, with some interesting new studies on the preCambrian life leading up to the Cambrian explosion.
We learned more about Tyrannosaurus rex and what we still have to learn, and we met Joe the dinosaur, the most open-access dinosaur ever. We learned how rapid evolution in one organism can cause a cascade of reactions throughout the ecosystem.
 We saw a whole host of dinosaurs in 3D, as well as horses and a lot of cool videos from the Science Studio. We saw a new animation explaining how the evolution of life affected the early atmosphere, oceans, and which rocks were formed.
We learned about the usefulness of evolution in medicine, how allergies can save your life, and that sharks, contrary to popular opinion, suffer from cancer just like the rest of us. We also saw a robot made completely out of prosthetics made for humans. Where will we go from here and how much farther can we go?
May your Halloween be filled with spooky fun!
Why do artists draw dinosaurs the way they do?
Scaly Spotted Feathered Frilled: How Do We Know what Dinosaurs Really Looked Like?
By Catherine Thimmesh
Publication date: 2013. 58 pg.
Houghton Mifflin Harcourt. ISBN: 978-0-547-99134-4.
Author: Catherine Thimmesh is an author of several books aimed at children in elementary to middle school. Her books have primarily focused on people, particularly women, doing science and politics, while bringing a wealth of information along with the human stories. As a result, her books should appeal to many people, helping them draw personal connections to the material. Two of her books, Girls Think of Everything and The Sky’s the Limit, have been listed as Smithsonian Notable Books, the latter book also listed as an Outstanding Science and Social Studies Trade Book for Children in 2002. Her book, Team Moon, discussing all the people besides the astronauts that made the moon landings a success, won the Sibert Award in 2007.
Iguanodon by Waterhouse Hawkins, 1850s
Illustrator: The book is beautifully illustrated by several well-known paleoartists, including John Sibbick, Greg Paul, Mark Hallett, Sylvia and Stephen Czerkas, and Tyler Keillor, as well as Charles Knight, the artist who created the classic pictures shaping the view of dinosaurs for more than a generation. Moreover, there are pictures of skeletons, sketches showing reconstruction from bone to skin, as well as Greg Paul’s classic silhouetted skeletons. As an added bonus, she includes a page at the end with a paragraph about each artist and a fun fact about each one. For instance, Mark Hallett was the person who coined the term “paleoartist.”
I have mentioned this book previously from a review by Brian Switek (for a librarian’s perspective, try the SLJ review here), but I finally got my hands on a copy so I can provide my perspective on it and I have to say, I agree with the other reviews. this is an excellent book well worth including in any elementary or middle school library or classroom. If you know someone who likes dinosaurs and likes to draw, they will like this book. This book gives a great discussion of how artists bring fossils to life, using new discoveries that are changing our views of how dinosaurs looked and comments straight from the artists crafting those visions.
 The book wastes no time, providing information on the inside covers. At the beginnig is a timeline showing the different Periods of the Mesozoic Era, with a short description of the overall climate, apleogeography, and notable fauna and flora of the time for each Period. Inside the back cover is a breakdown of the three major dinosaur groups, with a few general facts describing the dinosaursin each group and listing several representative dinosaurs for each group (along with page references for where they appear in the text). Other things that puts the book on my recommended list is a nice index, glossary, and references; things not often found in childrens’ books, which makes this book a cut above. This book does not take the sadly all too common tack of using the “it’s a childrens book” excuse to talk down to the audience and not worry about the facts 9except for one point mentioned by Switek which I will get to later).

Seismosaurus. Mark Hallett, 2006
The book starts with a discussion of questions the artists ask about the fossils themselves and what scientists can determine from them, such as what can the bones tell us about how they moved and what they ate. Further questions are asked about the plant fossils found in the rocks and what the rocks themselves say about the environment. Was it a desert? A beach? Shallow marine? Once they have what is known, then they can fill in what is not known. The next few pages provide a short history of dinosaur science and the art that sprung from it, such as the early Waterhouse Hawkins Crystal Palace sculptures in London during the 1850s and the Charles Knight paintings adorning the American Museum of Natural History. The book continues with information gleaned from trackways and new technologies helping to spur more discoveries. A discussion of the skeletons leads into reconstructing soft tissues such as muscle and eyes over the bones.
One area in which views have changed significantly is in the skin, which is discussed next. The book describes how new fossils are helping to inform new views, such as feathered raptors, although the book does not mention that we even have evidence of feathers on tyrannosaurs now. This is one area in which the book could have gone farther, it did not discuss much of the diversity of feathers, quills, and assorted spines we have recently found on a variety of dinosaurs. The use of modern animals and analogs and mechanical constraints, such as skin around joints, is also discussed. The problems and possibilities of how one decides on a color is discussed, ending on a mention of new fossils that are beginning to give us amazing insight into actual colors of some dinosaurs.
Yutyrannus, by Brian Choo via nature. 2012. Not in book.
The information here is not presented as definite conclusions, but as a puzzle, in which the scientists and artists take the various clues and try to piece them together. Sometimes, mistakes are made, such as the thumb spike of Iguanodon was originally thought to be a nose horn. The descriptions demonstrate how vibrant and dynamic the work is. As new fossils and new information comes to light, views change accordingly. The workers must constantly adapt as their knowledge base grows, with each new find getting us closer to a more accurate understanding.
The one quibble I would make with the book is one which Switek also mentioned. The book begins by stating that no one has ever seen a real, live dinosaur, which is not true. We see them every day. They are in fact the most diverse group of vertebrate animals outside of fish. The book mentions that dinosaurs and birds are thought to be related. In fact, it is often said that birds are dinosaurs because birds evolved from earlier dinosaurs. So just like children are still in the same family as their parents, birds are in the same family as all the other dinosaurs. This relationship is a key point in reconstructing fossil dinosaurs. Of course, a lot of people find it bothersome to constantly have to refer to non-avian dinosaurs to refer to only those that lived during the Mesozoic, so it is justifiable to say dinosaurs and birds, so long as it is made clear at the beginning that dinosaurs in that context are only referring to the Mesozoic ones. this book doesn’t do that, which is the only big gripe about the book. Still, a relatively minor complaint compared to the rest of the book, which is done wonderfully.
Forum Friday, October 18 Edition
 Time for another Forum Friday! As always, please leave comments about what you liked and what you would like to see more about. What did you think about our stories? Do you have a book or show you want reviewed? Have any resources you would like to see discussed? Have you made an interactive or other resource that you think might be beneficial to others? Let us know.
In the meantime, we have discussed different maps showing the world through geologic time (including some great apps) and ways of showing the tree of life.
On Facebook we celebrated National Fossil Day and Earth Science Week, looking at fossilized arthropod brains, new skulls of Homo erectus and what that means to our understanding of human evolution, how cartilage helped dinosaurs get so big, and learned about the origin of flowering plants. We learned a website letting you make your own geologic time chart. We found a great video discussing what phylogenetic trees are and how to interpret them.
Going along with Earth Science Week, we found special Earth Science Week resources and a STEM Student Research Handbook put out by the NSTA, as well as resources available at Scitable. We discussed the pros and cons of the NGSS and the benefits of preschool education.
We learned about unusual deep sea creatures off the East Coast, more ways to tell moths and butterflies apart, how Black Skimmer birds can skim, and how the arapaima’s armor protects them from piranha. We saw how color evolved and its role in mimicry, how hands came before bipedalism, and how epigenetics affects evolution (it’s not just about mutations).
It’s your turn. What do you want to talk about?
Life is one big family
 Teaching how all life is interrelated is a whole lot easier if you can show something akin to a family tree for living organisms. The Paleobiology Database has all the fossils organized by taxonomic relationships to help you find things in the database, but it is not very useful for visualizations. The Encyclopedia of Life has lot of information and multimedia available for over a million individual species and shows how they are classified and is quite useful if one is looking for information on a particular species. But again, it is not very visual.
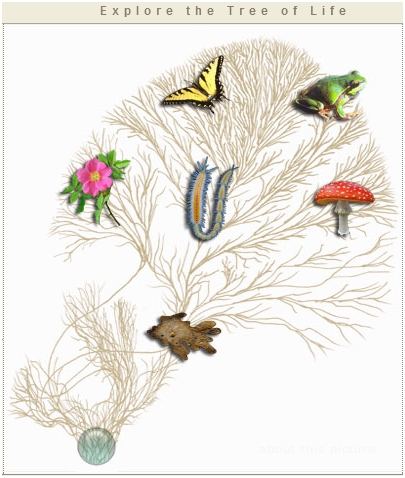
The Tree of Life website is an excellent website providing a great deal of information on phylogenetic relationships (for good discussion of phylogenetics, try here and here), providing abundant references on the primary literature discussing how scientists think various organisms are related. They work in collaboration with the Encyclopedia of Life, with the EOL focusing on species pages and TOL focusing on relationships. On TOL, one can start at the base of the tree and click on various branches following different groups into smaller and smaller groups, with each page providing what groups are descended from the starting group. For instance, the base of the tree starts with links to eubacteria, eukaryotes, and archaea, with viruses with a question mark. Each one is hyperlinked to a page discussing relationships within that group. It also provides a discussion of possible alternative branchings as well. Thus, the relationships are not presented as “we know this to be true,” but as an active, ongoing process of discovery and research. It is often highly technical, but would be extremely useful for high school students working on an evolutionary or biodiversity topic.

The Tree of Life and the Encyclopedia of Life are great sources for information on species and their phylogenetic relationships, but if you want better visualizations of the sum total of biodiversity, there are other websites that are definitely worth your time.
The first I would like to mention is the Tree of Life interactive by the Wellcome Trust and BBC. Watch the great video with David Attenborough first, then dive into the tree itself. The tree simplifies life to about 100 representative species. It is seriously weighted toward mammals, so provides a very skewed version of biodiversity, but the presentation should appeal to those who are most interested in the overall development from bacteria to humans. If once clicks on any individual species, it highlights the path to the base of the tree and provides a text description and in some cases pictures, a video, and locations. Click on another species and the path to the last common ancestor of the two selected species is highlighted. All the files are open source and available for free download, including the images and videos.

 Another interesting site is the Time Tree. This site has a poster that shows 1610 families of organisms available for free download. The poster does a better job of showing the true diversity, but is still heavily weighted towards eukaryotes. However, the real purpose of the site is to provide divergence dates between two species. Simply type in two species names using either scientific (say, Homo sapiens and Gallus gallus) or common name (say, human and chicken) and it will provide how long ago their last common ancestor lived. It should be noted here that the dates listed are estimates based on molecular data. They should not be considered as conclusive dates or anywhere near as precise as listed. Indeed, the value given is a mean value of several estimates, with the median value also given, as well as what they call an “expert result” (which they sadly do not explain). In addition, they provide the scientific references the results came from and the dates provided for each, which can be quite broad. In the example above, those values range from 196.5 to 328.4 million years ago, but of the nine studies listed, all but two fall within 317.9 and 328.4 million years ago. There is also a mobile version of the site, as well as an iPhone/iPad app, as well as a book.
Another site of interest is Evogeneao.com. They have an interesting Great Tree of Life, as they call it, which like most others is heavily weighted toward eukaryotes. They have good explanations of evolution, along with a set of resources for teachers, including an interesting suggestion for how to introduce evolution to students. The interesting part of this site is their discussion of evolutionary genealogy, in which they extend the idea of a family tree farther back than it typically seen. They provide methods to calculate how far removed you are from other species. You can pick from a list of animals and it will tell you how closely you are related. For instance, choosing dolphin returns an estimate of 27 millionth cousin, 9 million times removed. That nicely encapsulates not only the idea of relatedness, but the immense scales of time we are talking about.

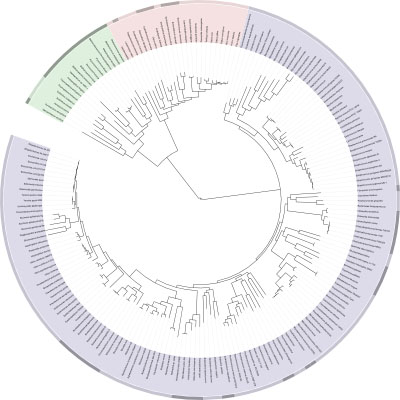 The Interactive Tree of Life, or iTOL, is another interesting site that may be of interest to high school teachers. This site utilizes genomic data as the basis of its trees and, unlike the others, provides a better visual indicating how truly diverse prokaryotes are in relation to us. It also allows you to print out phylogenetic trees in different formats, depending on your preferences and what sort of information you want to display. You can even upload your own data if you wish, but most teachers will likely choose to stick with the displays already provided, as there are simpler programs to deal with trees that any but the most precocious senior high school student (or college student for that matter) may wish to create.
There are a few other interactive trees out there that may be more appropriate to younger viewers. One is at the London Natural History Museum website. This one is very simplistic, having only sixteen branches, with four of them being primates, but it gets the point across. This interactive is limited to providing the link between any two branches and the name of the group containing both. For instance, clicking on the banana and the butterfly gives the name Eukaryota. Another site provides an interactive for the poster Charles Darwin’s Tree of Life. This interactive allows one to zoom in on any part of the tree and if one clicks on an animal, a short description of the animal is provided. Sadly, the two best interactives I have yet seen are not available on the internet. I had the opportunity to explore DeepTree at the Harvard Natural History Museum and it is truly spectacular, as is their FloTree. If you get a chance to see them, you should. Hopefully, one day they will be available in a broader format than now.
All of this assumes of course, that people actually know how to read these trees, which is a false assumption in that most people really do not. So it would be useful to spend some time getting familiar with proper interpretation of them before using them in class. There are several resources explaining this (such as here and a really excellent video here), so I will not put a tutorial on here unless there are requests to do so.
All images posted here are from the websites being discussed and are copyrighted to them.
You were here: Maps for seeing geography through time
It may seem that the earth is pretty stable. You can always count on the mountains being there when you look for them. But the Earth is a dynamic place. Volcanoes, floods, landslides, and earthquakes all change the landscape in ways we can see quickly. What we don’t typically see is that if we expand these processes over long periods of time, those same processes alter the landscape far beyond our experiences. The surface of the Earth is covered in a crust broken up into numerous plates, which are constantly shifting and moving. The plates only move between 2.5 – 15 cm/year (the previous link contains information on how this is measured and provides activities for teachers for use in the classroom), but add this up over millions of years and the Earth looks quite different. Add into this mountain-building and erosion wearing down the mountains and you get radically different geographies for the planet.
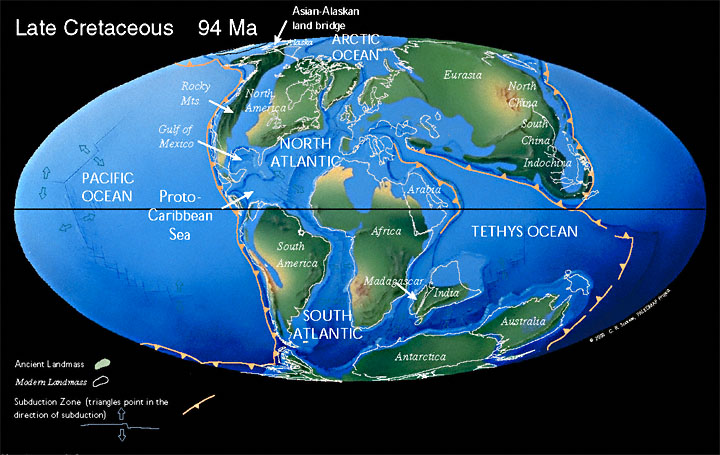 So what did the Earth look like in the past? There are two excellent sources providing maps of the planet through time. The first is the PALEOMAP Project, by Dr. Christopher Scotese. On this website, you will find maps ranging from 650 million years ago to the modern day and even into the future. There are 3D animated globes and interactive maps. He includes a methods section for how the maps wer put together and a list of references and publications. There is also a climate history section providing brief descriptions of the climate at various points in time. For teachers, there are several educational resources available, some of which are free, but others are available for a fee. There is even an app for the iPhone/iPad. It is not available yet for either android or Windows, but that has been admirably taken care of by the Howard Hughes Medical Institute with their Earthviewer app and they have done a wonderful job. the app is fully interactive, allowing easy scrolling through time and full rotation of the globe. You can also track atmospheric oxygen and carbon dioxide, day length, important fossils, biological and geological events, and major meteor impacts. The app even provides a bibliography of their source material. In addition to the maps from Dr. Scotese, the app extends the timeline back to 4.5 billion years (although this extension is obviously not nearly as detailed as the Scotese maps due to the greatly extended time and the greatly decreased amount of available data). All in all, a great app, also reviewed by the NSTA.
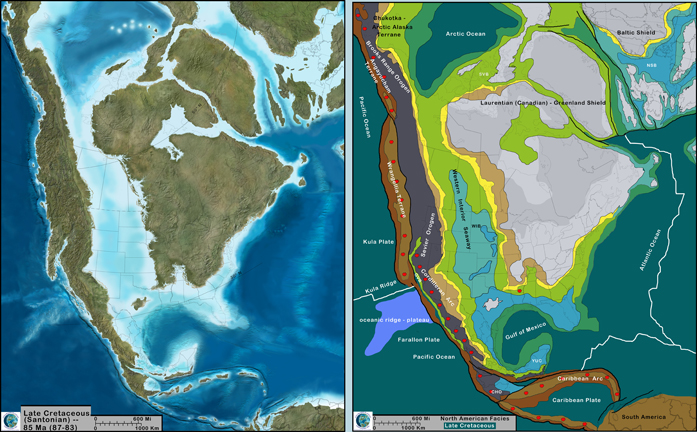
The second site that will be of interest is the Library of Paleogeography run by Dr. Ron Blakely. These maps cover approximately the same time frame as those provided by Dr. Scotese and are not animated. However, Dr. Blakely provides maps in different projections and provides regional coverage beyond that of global maps. So if you are specifically interested in paleogeographic maps of North America and Europe, this is an excellent resource.
A third site also provides paleogeographic maps which are very useful. In this case, the maps are secondary to the main purpose of mapping fossil locations. The Paleobiology Database contains records of fossil locations that have been published in the primary literature. One can perform a search by organism or group, country, rock unit or type, time interval, paleoenvironment, or publication. The results from the search are mapped onto global maps based on the PALEMAP Project.

Dromeosaur fossils in 70 million year old rocks.
All of these sources are available to the public and are used by professional researchers. Therefore, one can safely assume they represent accurate assessments of current, generally accepted thoughts on our Earth through time. You may notice that maps from Scotese and Blakely may not completely agree on all aspects. This is because it is very hard to piece together all the evidence and trace the movements of the continents backwards through time. Often, the data is incomplete and they have to make judgment calls based on the available evidence. Not everyone makes the same choices. This is true even for maps of current geography and is even more so for paleogeography. As we get more data and better techniques, those disagreements become fewer and fewer, but there is still much work to be done, so these maps can and will most likely be refined in the future to reflect new research.
Forum Friday
Time again for another Forum Friday!
To recap, since last time, we have given a positive review of Nic Bishop and his book, Digging for Bird-Dinosaurs: An Expedition to Madagascar, and looked at several ways you can present geological time.
Over on our Facebook page, we looked at the books Dinosaur Art; All Yesterdays; Scaly, Spotted, Feathered, Frilled; and The Smile of a Dolphin. We learned about a science cafe on reconstructing dinosaurs, Thor helping to get girls excited about science, how to study, and how to interpret evidence to avoid Bigfoot and pseudoscientific thinking.
We found a fascinating, interactive tree of life, and a new STEM education database. Sadly, the database is closed due to government shutdown, and Charlie’s Playhouse, maker of the great Giant Timeline Mat, also closed, but they have opened an educational site to introduce kids to evolution.
We learned dinosaurs did not have bunny hands, clues to the origin of multicellular life, photosynthesis, flowering plants, and how the evolution of mammals correlated with the rise of flowers. We are learning to use our knowledge of evolution to outwit viruses and the predictive power of evolutionary theory.
Finally, don’t forget that Earth Science Week (October 13-19) and National Fossil Day (October 17) are coming up.
What stories did you find interesting? Join the conversation, tell us what you think and what you’ve found.
Dig up Digging for Bird-Dinosaurs
Digging for Bird-Dinosaurs: An Expedition to Madagascar
By Dr. Nic Bishop
Publication date 2000. 48 pg. Houghton Mifflin Company. ISBN: 0-395-96056-8.
Nic Bishop has combined his avid love of photography and his doctorate in biology into a prize-winning series of books for children. His books include a series on specific groups of animals, such as snakes, lizards, marsupials, spiders, butterflies, as well as a “scientist in the field” series. It is the latter series I am discussing today. There are plenty of books available discussing the different animals, although few with the quality of photography and biological expertise Bishop brings to his work, but there are precious few that discuss the work of the scientist in bringing that knowledge to light as the discoveries are being made, which is what particularly interests me here.
Digging for Bird-Dinosaurs was published in 2000, so it is not current, but is still topical and relevant and should stay so for some time. The only issues with the age of the book are new details that have been discovered, which further confirm the hypotheses presented in the book. When the book was written, most scientists had been convinced that birds evolve from dinosaurs for many reasons which are mentioned in the book. Since the book has been published, many new feathered dinosaurs have been found which clearly show the relationships in further detail. But the book is not really about the relationships between birds and non-avian dinosaurs, although it discusses them quite well, it is about the experience of the people on an expedition to Madagascar in 1998, what it is like being in the field and the study of some of the fossils that were discovered. If you want to know what it is like to go to another country and dig for dinosaurs, this book will be of interest and should make interesting reading for kids in elementary or middle school.
The expedition was led by Dr. David Krause, a professor at Stony Brook University in New York who has been running paleontological expeditions to Madagascar since the early 1990s and is still doing so, although the book is focused on his colleague, Dr. Cathy Forster, also of Stony Brook (at the time, but now an Associate Professor at George Washington University). She, like Krause, is a noted paleontologist and is likely the focus of the book because of the relative paucity of women in the field sciences. These days, if one goes to a meeting of the Society of Vertebrate Paleontology, women are well represented, but in the 1990s, most of these women were still students looking to the few women like Dr. Forster who were forging careers.

Rahonavis. cc Wikipedia
The book follows their experiences in the field and the discovery of a particularly interesting bird-like creature they eventually name Rahonavis. The book continues with the team bringing the fossils back, preparing them out of the rock and studying them, coming to the conclusion that the animal was the closest known bird to Archaeopteryx, which is generally considered the earliest known bird. It is so close in fact, that many scientists today consider it actually closer in lineage to the dinosaurs known as dromeosaurs, which include animals like Velociraptor, than it is to birds. This placement is a great demonstration that birds really did evolve from dinosaurs. It is so hard to tell the difference between “dinosaur” and “bird” in the earliest bird-like forms because they are not distinct, separate groups. Birds are merely a subset, a type of dinosaur, in much the same way that mice are rodents, which are also mammals, which are also amniotes, which are also vertebrates, etc. Therefore, whether or not Rohanavis falls out before or after Archaeopteryx in the lineage is a mere detail, changing nothing of the story. It makes as much difference to the evolution of birds as it does which of a set of twins was born first or second, a matter of inconsequential minutes in evolutionary time.
One of the fascinating parts of the book is when Dr. Krause and Dr. Forster discuss the local people helping them. The villagers are very poor, with no access to healthcare or schools. Dr. Krause was concerned enough that he founded the nonprofit Madagascar Ankizy Fund, which supplies needed healthcare to the area, as well as building schools and providing teachers. Dr. Krause and Dr. Forster came to Madagascar to hunt for fossils. But while they have found a great many spectacular finds, perhaps their greatest accomplishment is in the humanitarian work on behalf of the people who live there.

Time Enough to Evolve
Time. My day job has kept me extraordinarily busy and away from paleoaerie for a while, thus the lack of new posts here recently, so I thought now would be a good time to discuss temporal issues. Fortunately, things have calmed down a bit and I can get back to working on evolving the website. Speaking of which, it is time I got started.
Time is a subject about which much has been written, especially about our perceptions of time. One of the difficulties some people have with evolution is they don’t see how small changes in a population could lead to the diversity of life we see. They read about small changes in bacteria or they hear about how the average height and longevity of people have changed in the past few decades. They understand that a wide variety of dogs have been created through artificial breeding. But, the dog is still a dog, the bacterium is still a bacterium, people have not changed in their personal experience.
Unfortunately, they do not see how their personal experience misleads them. To them, the world is essentially unchanging. While human culture may change, the mountains do not move and species do not change. It is a common human tendency to assume that whatever is now has been and will always be. However, while we may think of hundreds of years as ancient history and thousands of years as vast swaths of time, they are a tiny speck of how long evolution has been altering life on this planet.
So how does one get people to comprehend the incomprehensibly vast time frames we are talking about? People have tried several ways. One could always simply show them the geologic time scale.
This is the standard geologic time scale used by professionals the world over, put out by the Geological Society of America. But to most people, this doesn’t really help. It is words and numbers and humans are just not that good at really getting a gut level understanding of figures like this. So many people have come up with a variety of metaphors. A common metaphor is compressing the age of the universe into a single year, a la the Cosmic Calendar, as popularized by Carl Sagan and expanded upon nicely by Arif Babul at the University of Victoria.
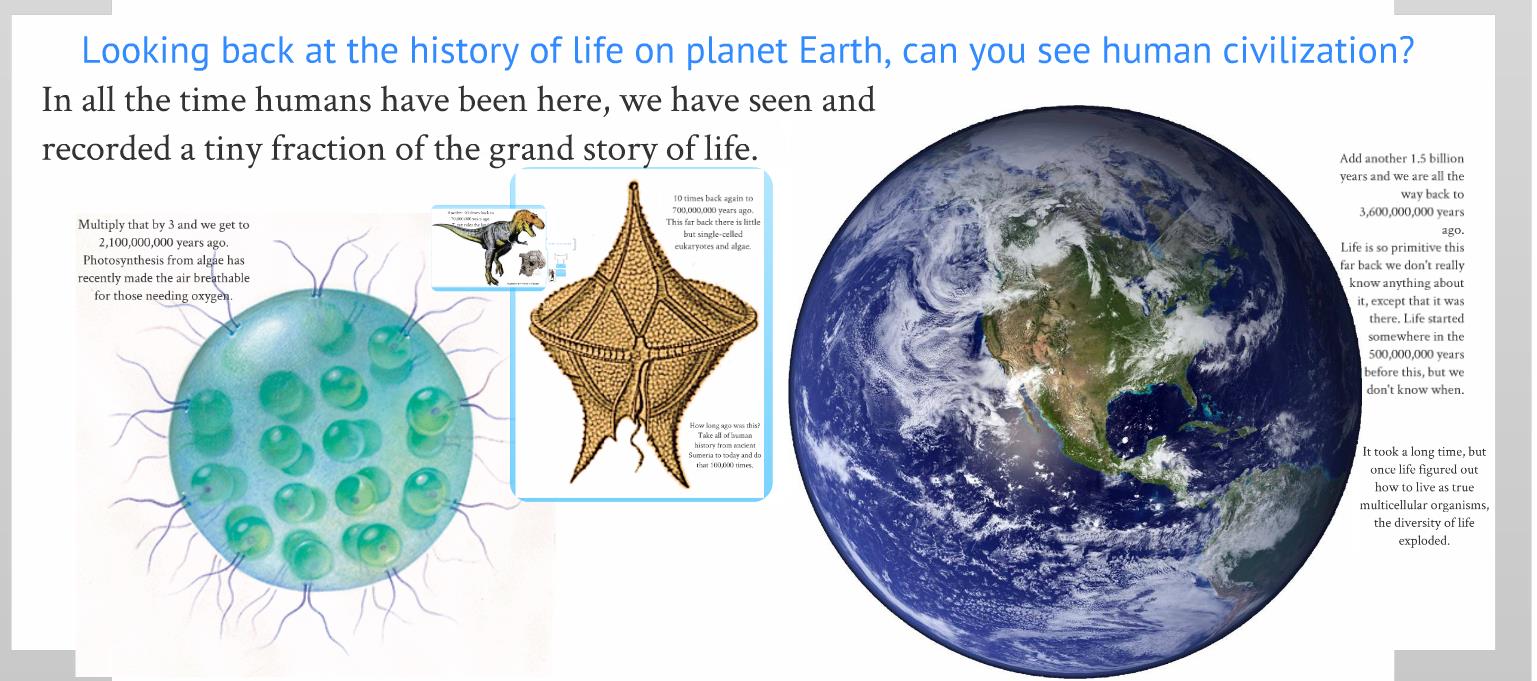
 The idea of condensing all of time into a calendar can be re-envisioned as a clock. If we extend the circular motif to three dimensions, we find another popular image in that of a great spiral of life.
 We could also think of time as distance. If, for instance, we decided to get in our car at the Jacksonville, FL airport and drive west and we thought of each mile being 1,000,000 years, we would have to drive to Fairbanks, AL to reach the whole age of the earth. All of human history would be passed by in less than two standard car lengths. An hour into your drive you would pass the asteroid marking the end of the Cretaceous Period and the demise of the non-avian dinosaurs. You would barely be into Tennessee before you passed the Cambrian Explosion over 500,000,000 years ago. By the time you got back to the origins of life, you would be entering the Yukon territories in Canada.
 But these are all static images. Perhaps you would prefer a more interactive approach, such as this interactive timeline or perhaps this one.

Perhaps you would prefer an interactive in which time was expressed in terms of size.
 These are just a few of the ways that time spans can be visualized. Are you looking for something you can bring into a classroom that the students can touch and experiment with? Try having them build a timeline of their own. What is your favorite? Do you have other ideas?

